There is a common belief that you need to compute a complete link budget to optimize the operating point of a nonlinear amplifier.
Clearly, a compromise is necessary between the nonlinear distortions in the amplifier and the signal-to-noise ratio in the receiver demodulator.
This compromise can be obtained from the complete link budget by trial and error, but this is not the best way.
I will show how to choose the optimum operating point and optimum signal-to-noise ratio before computing the full link budget and then using this values in the link budget.
In this article, I will optimize the nominal RF output power of the amplifier for a given specified total signal-to-noise ratio.
This nominal RF power is generally defined as the saturated output power for a traveling wave tube amplifier (TWTA) or the 1 dB, 2 dB, or 3 dB compression output power for a solid-state power amplifier (SSPA).
Hypotheses
I suppose that the amplifier is known by its measured or simulated (by CAD) nonlinear performance curves, typically the Noise Power Ratio (NPR) or Error Vector Magnitude (EVM) depending on the type of signal that will be used.
If only AM/AM and AM/PM curves are known, it will be necessary to perform a simulation with the wanted type of signal at different input powers to obtain either the NPR or the EVM curve.
I will suppose, in a first approximation, that these curves do not vary too much with nominal amplifier power. If some variation happens, I will iterate after the first optimum nominal power computation.
I suppose also that I know the performances of the receiver and demodulator for the type of signal to be used. Typically, this is a curve giving the global signal-to-noise ratio that is necessary at the input of the demodulator for correct demodulation (with the specified bit error rate or BER) of the wanted type of signal, modulation, and error-correcting code. In DVB-S standards, this specification is given as a curve of bit-per-symbol efficiency as a function of the ratio of bit energy Eb (or symbol energy Es) to noise spectral power density N0 (see figure 3).
The last hypothesis is that the noise or distortion measured by NPR or EVM is nearly Gaussian and independent of the signal so that it can be added in power to the thermal noise in the receiver. Be wary that NPR is a signal-to-noise power ratio type of measurement whereas EVM is a noise-to-signal voltage ratio type of measurement.
I will define and use in all computations:

The name C/I comes from the carrier-to-intermodulation ratio.
The total signal-to-noise-plus-intermodulation ratio (SNIR) or C/(N+I) will be given by:

Last point: for this article, the cost function (or the parameter to be optimized) is the nominal power of the amplifier. The goal is to get the specified total signal-to-noise ratio at the input of the demodulator and BER at the output with the lowest possible amplifier nominal power.
Transmission link
The nonlinear transmission link is given in the following figure.
For the moment, we do not consider the gains and losses in the link between the transmitter and receiver, these will be computed later. The value of signal power C is not the same at the output of the transmitter and at the input of the receiver. Their absolute values are not required as we optimize only the values of carrier-to-intermodulation ratio C/I and signal-to-noise ratio C/N to get the highest possible total signal-to-noise ratio C/(N+I) with the lowest possible amplifier nominal power Pnom.
Necessary curves
Distortion curve
The C/I curve (from NPR or EVM) is given as a function of relative output power or operating point or its opposite the output power back-off (OBO). An exemple is given in the following figure. The curve in figure 2 is typical of a measured or computed curve for single carrier 16 APSK modulation.
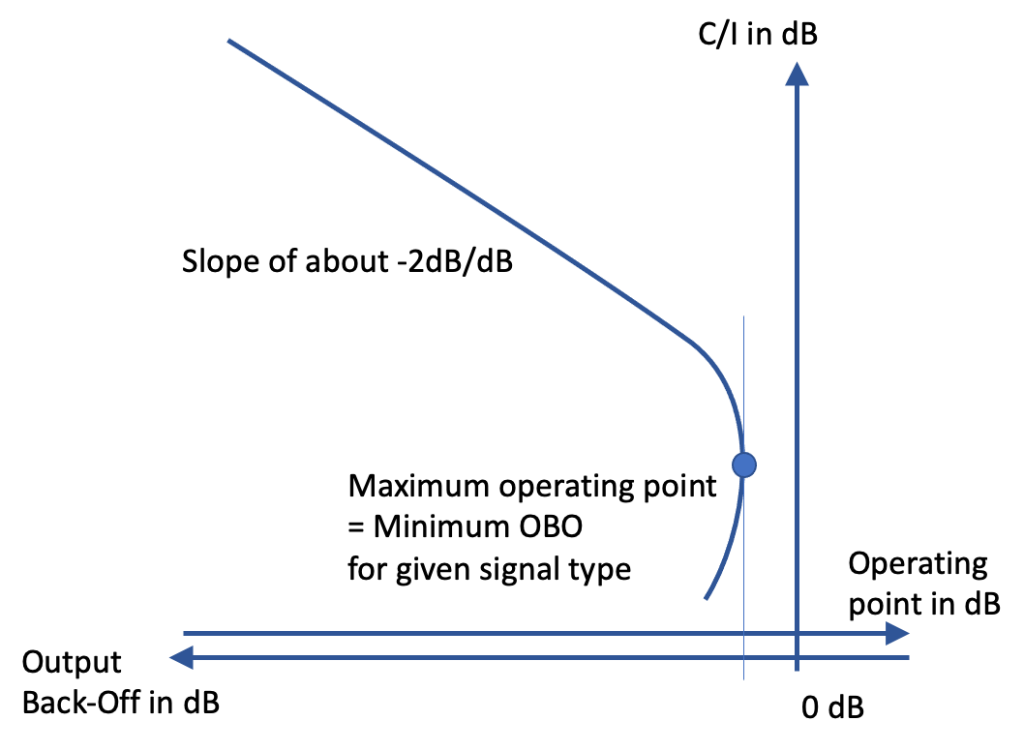
Demodulator curve
An exemple of a demodulator performance curve is given in the next figure. It is compared to the Shannon limit, which is the maximum value that can be obtained for spectrum efficiency in bits per symbol.
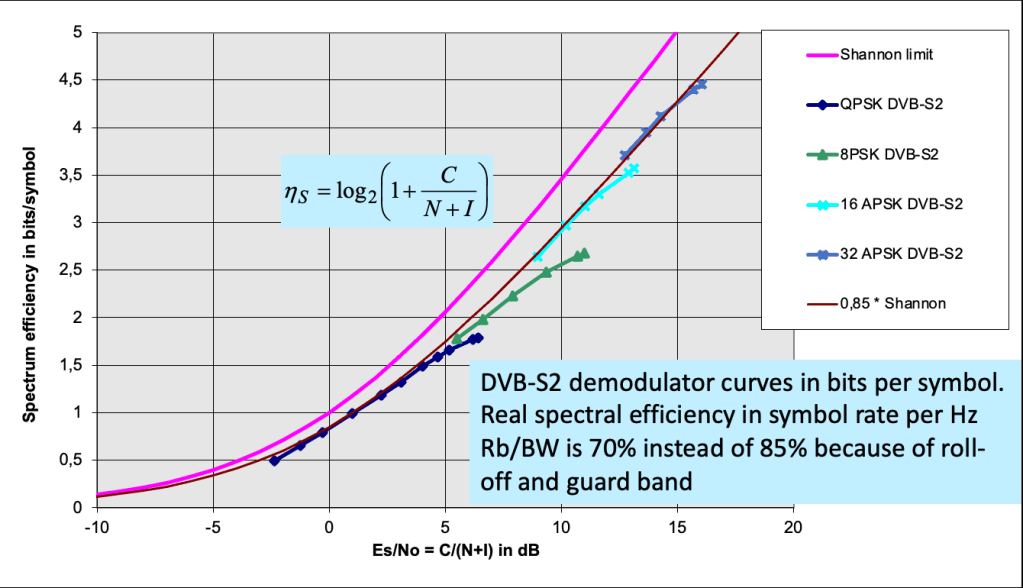
I will not use all the figure in this article but only one point such as the one for 16 APSK modulation (already used for the C/I curve in figure 2) with some error code. The necessary signal-to-noise ratio for this modulation and code is 13.5 dB giving 3.3 useful bits per symbol (from 4 raw bits per symbol).

This is the total signal-to-noise ratio that must be obtained at the input of the demodulator through the choice of amplifier power and amplifier operating point.
Noise curves
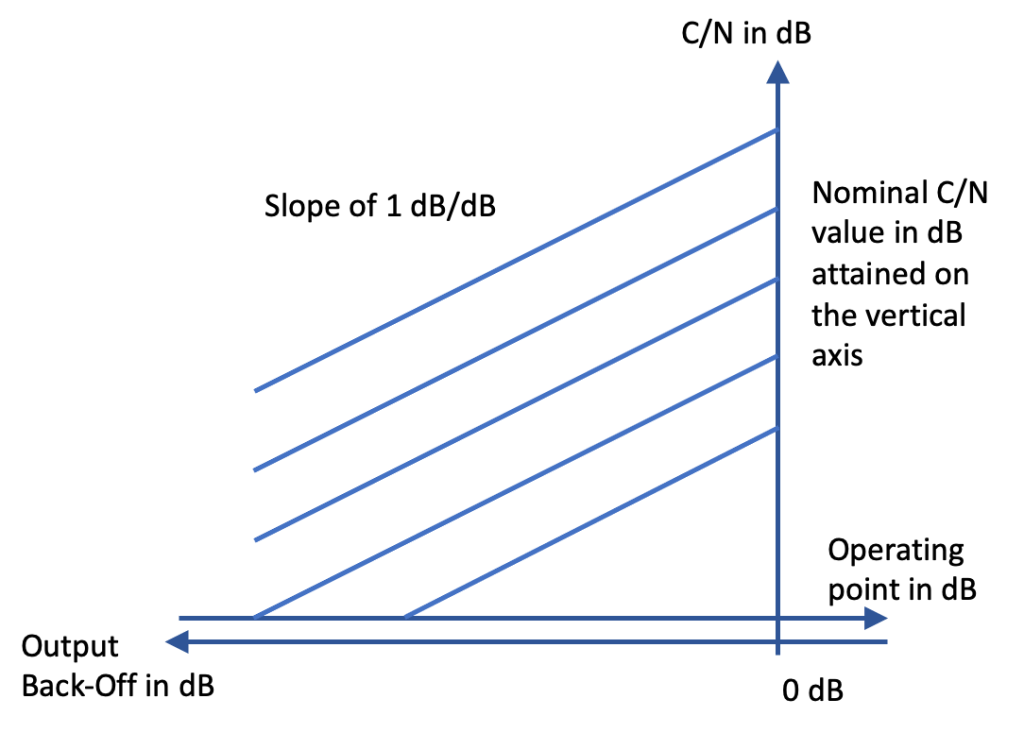
I will use a normalised variable for the nominal signal-to-noise ratio at the input of the receiver: it is the signal-to-noise ratio that is obtained on a continuous wave (CW) in the nominal bandwidth of the demodulator, which is equal to the symbol rate for a single carrier or to the channel bandwidth for multi-carrier.
When increasing the operating point of the amplifier, the signal-to-noise ratio will increase along a straight line with slope 1 dB/dB.
At nominal power, the signal-to-noise ratio is given by the nominal signal-to-noise ratio. Any number of such curves can be drawn, one for each value of nominal signal-to-noise ratio.
Addition of noise and distortion
When adding the noise power and the distortion power we get a new curve for each of the noise power curves. The addition is done in power, not in dB. When C/N and C/I are equal, the addition gives 3 dB less C/(N+I).
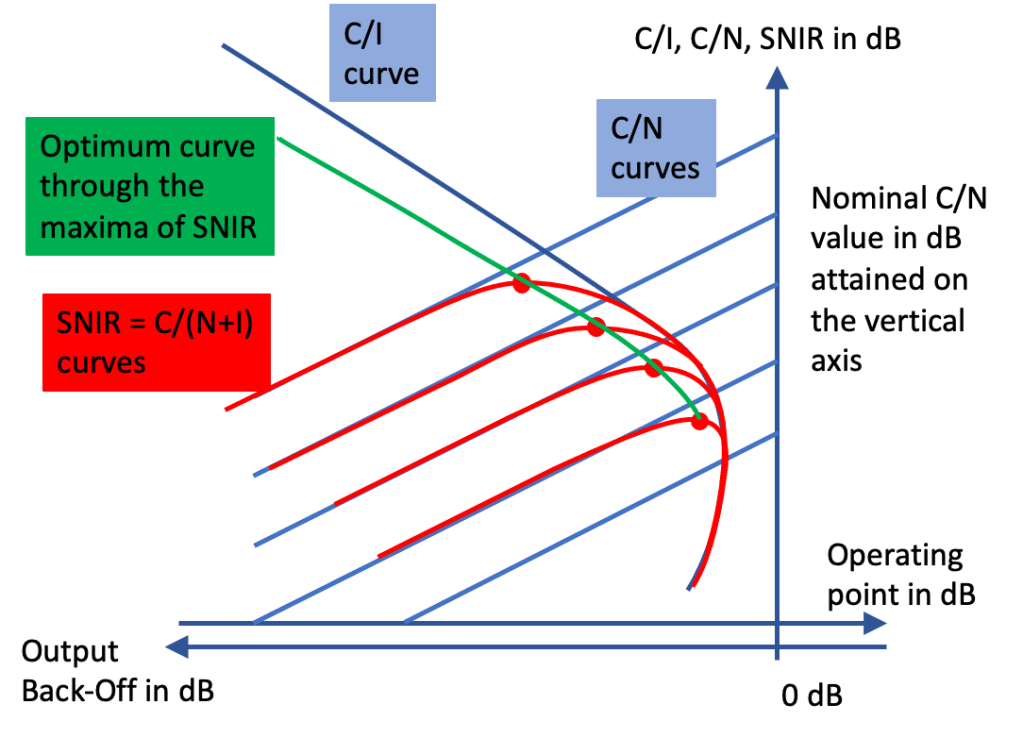
Each of these SNIR curves (in red on the next figure) go through a maximum of the total signal-to-noise-plus-intermodulation ratio.
This maximum is slightly to the left of the point where C/N and C/I are equal because of the different slopes for both curves.
Through all these maxima, an optimum curve can be drawn (in green).
Each point of this optimum curve gives the best combination of noise and intermodulation for a specified C/(N+I), e. g. 13.5 dB.
The abscissa of this point gives the operating point or the OBO of the amplifier.

The corresponding C/I is obtained at the same operating point on the C/I curve.
The corresponding C/N curves gives the value of the minimum nominal signal-to-noise ratio that must be obtained in the link budget.
The optimum C/I is higher than the optimum C/N at operating point because of the different slopes in C/N and C/I curves.
A lower value of nominal C/N would give a C/(N+I) curve with a maximum lower than the specified one so it cannot be used.
A higher value of operating point would give a lower C/I and then a higher nominal C/N would be needed, a higher nominal power amplifier would be necessary.
Conclusion
The link budget can now be computed with the objective to get the necessary nominal C/N in the signal bandwidth when the amplifier is at nominal power using one of the formulas given in the previous article.
The nominal power that will be obtained with the proposed method is the minimum one that will give the wanted total signal-to-noise ratio at the input of the demodulator and the wanted bit error rate
The computation of the optimum operating point, C/I and C/N has been presented here with a geometrical process, but it can be obtained with an algebraic computation such as the one proposed in [1, 2]
Reference
- [1] Sombrin, J., “A new criterion for the comparison of TWT and linearized TWT and for the optimization of linearizers used in transmission systems”, ESA-NATO 1997 Workshop on Microwave Tubes for Space, Military and Commercial Applications, 7–10 April 1997, ESTEC, Noordwijk, The Netherlands.
- [2] J. Sombrin, “Optimization criteria for power amplifiers”, International Journal of Microwave and Wireless Technologies, Volume 3, issue 1, pp. 35-45, published online February 3, 2011
